
Big Games and High Stakes - EDO quantifies how live sports drive premium engagement for advertisers
Challenge
EDO’s client is a network that produces live sports events, an activity that demands significant planning and investment. Accordingly, when they sell ads for live events, they charge advertisers a premium cost-per-thousand (CPM) that reflects such high-profile, must-see programming.
Raising advertisers’ stakes even further, many invest in multifaceted sponsorship packages, which supplement standard ad units with branding and special integration units, such as billboards, open and rejoins, and lower thirds, which by definition are difficult to value with standard metrics such as panel-based exposure or survey-based recall studies.
In return for such investments, the sports network needs to clearly demonstrate that the advertiser is achieving premium results. The network also must deliver a clear R.O.I. picture to prospective advertisers who show interest in sponsoring future events.
Key Considerations
-
CPM is higher than for many other programs.
-
Advertisers often invest in multi-faceted sponsorships, raising stakes further.
-
Network must show that superior value is being delivered to more than match higher costs.
Success Metrics
-
Definitively and quantitatively demonstrate to advertisers that higher CPM is more than justified.
-
Show that advertisements aired during live sporting events trigger viewers to investigate and engage with the brand or product being shown.
Solution
To make its case to advertisers, the network needed a solution that was highly quantitative, broad enough to cover standard ad units and sponsorship elements, and driven by a clear, compelling performance metric. The solution needed to measure the performance of TV advertisements for all advertisers, producing actionable insights both for individual advertisers as well as across all advertisers.
Why They Chose EDO
The network needed a quant-driven solution that could cover standard ad units as well as custom integrations and branding. They also wanted to look at historical data across all advertisers without having to rely on private data from any advertisers. Such historical, syndicated data would enable a broad set of benchmarks that could be used to contextualize results.
It was critical to find the right Key Performance Metrics (KPI), one that advertisers would find valuable and that aligned with TV’s strengths in delivering an engaged audience. Additionally, the KPI should not depend on too many factors outside the control of the network, such as actual sales, which are impacted by issues like competitive pricing, inventory levels, and customer reviews.
What EDO Did
We used EDO’s Ad EnGage Convergent to measure the engagement driven by all ads during live sporting events over past several years for all major advertisers. We additionally measured engagement driven by all standard entertainment programming to serve as a benchmark.
Our team aggregated the results by sporting event, measuring the levels of online engagement driven by different sporting events on a per-person, per-second basis. The format of our results maximizes comparability across diverse program types.
We produced results by advertiser and by category. All results were computed and delivered in real time with regular updates.
We worked with the client to generate deeper insights for their highest-priority advertisers and to identify particularly compelling results worth sharing for other advertisers.
We also collaborated with the network to identify timestamps of special integration units to precisely measure consumer engagement driven by those units, equating their impact relative to the impact of standard ad units.
Results
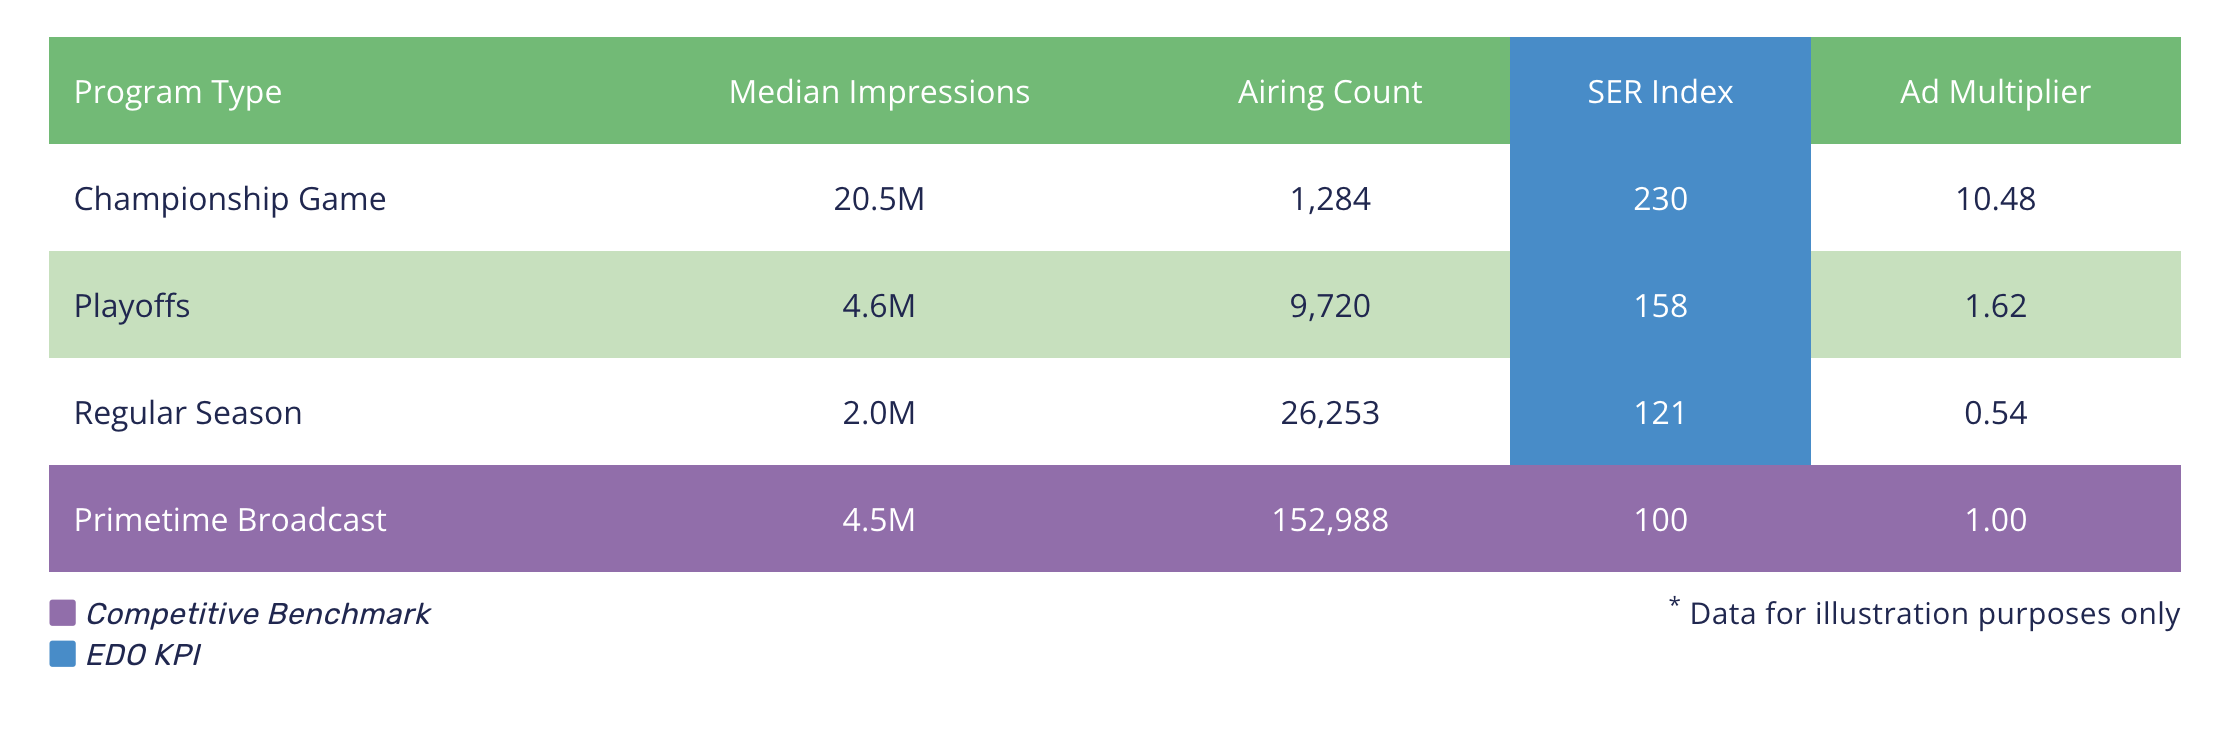
Performance By Program Type Compared to Benchmark*
Based on EDO’s SER Index metric, someone who viewed a TV ad unit during the Championship Game was 2.30x more likely to engage online with the brand being advertised than someone who viewed a TV ad unit during primetime broadcast programming. This also means that, all other things being equal, viewers of the Championship Game are 2.30x as engaged as viewers of primetime broadcast programming.
Based on EDO’s Ad Multiplier metric, an advertiser would require 10.48 TV ad units during primetime broadcast programming to generate the same amount of impact as would be expected from a single TV ad unit during the Championship Game.
“EDO quantified for us the impact of the sponsorships and gave our advertisers confidence that the sponsorship units are working for them.”
– Marketing Executive, National sports network
Impact
The network’s ad sales team now has more powerful data and tools to demonstrate the value of live sports to new and existing advertisers.
For the client’s sales team, EDOs data provided a new way to articulate the value of live sports to advertisers. They shared KPI results with clients via email and digital and in-person presentations. The broader set of data provided by EDO also gave the sales team better ways quantify the impact of a sponsorship as a whole, including custom integrations.
As a plus: the team has taken advantage of EDO’s historical data to build the case for key clients that the network has delivered value for their specific brands in the past.
It’s always been assumed that Live Sports drive more engagement than typical ads — and the more high profile the game, the higher the engagement. EDO finally provides measurement and data to prove this in a quantitative and rigorous way.